Climate Warming Ethiopian Handwoven Table Runner
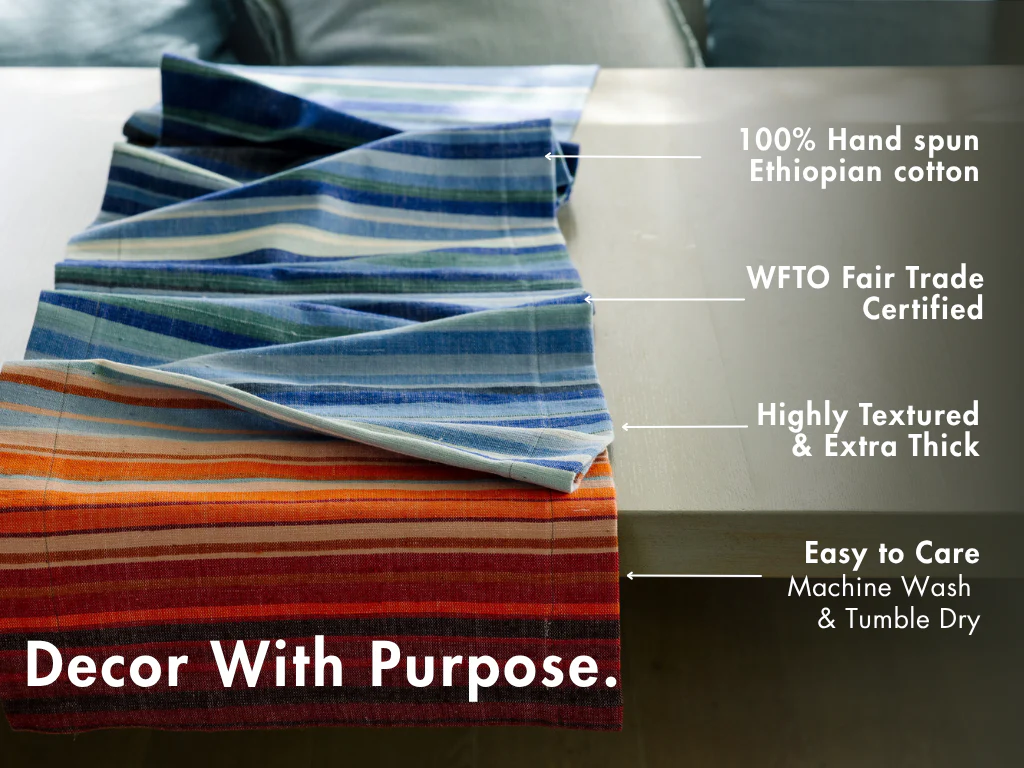
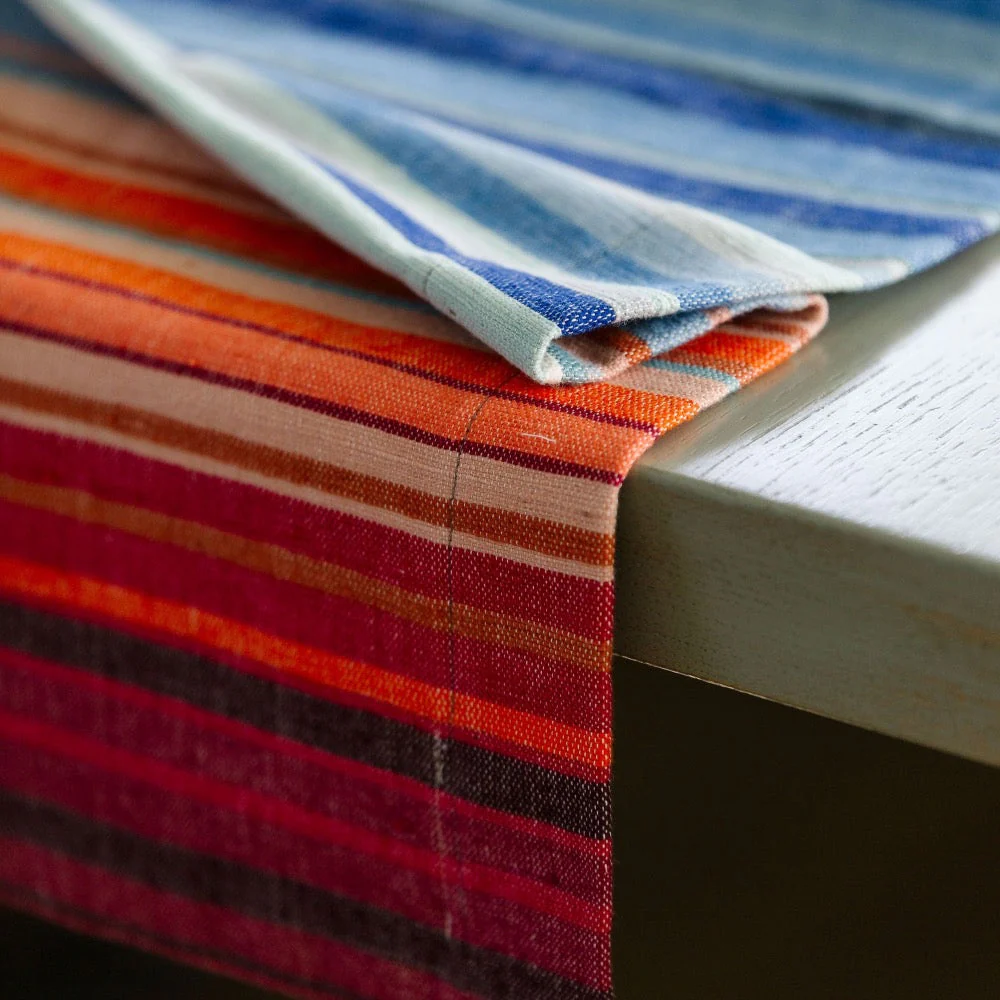
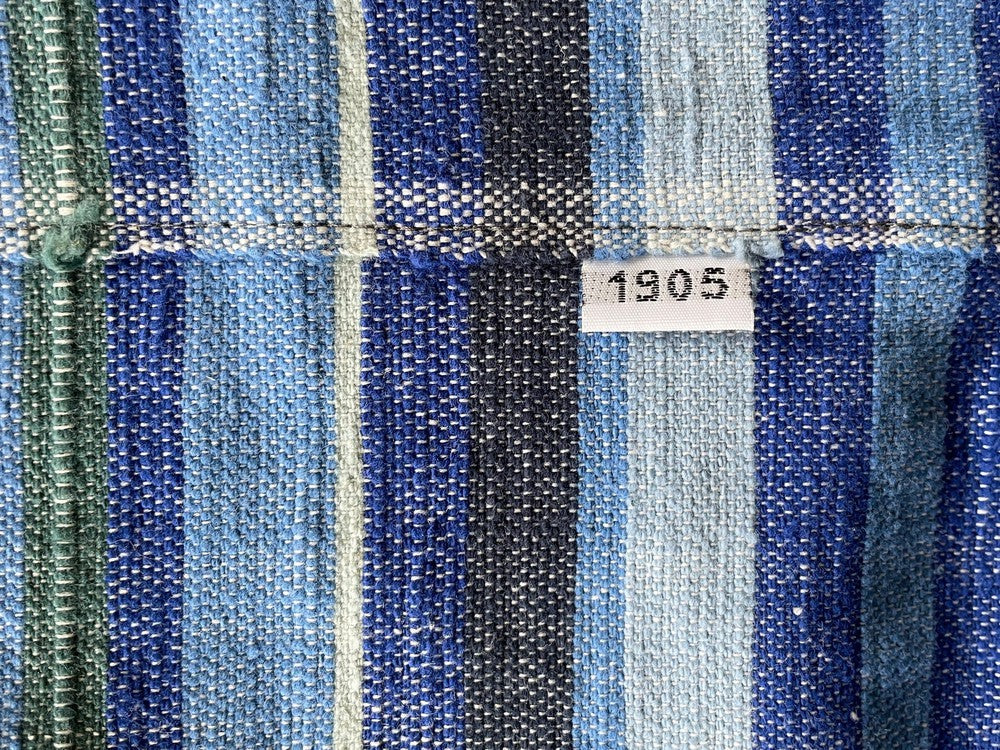
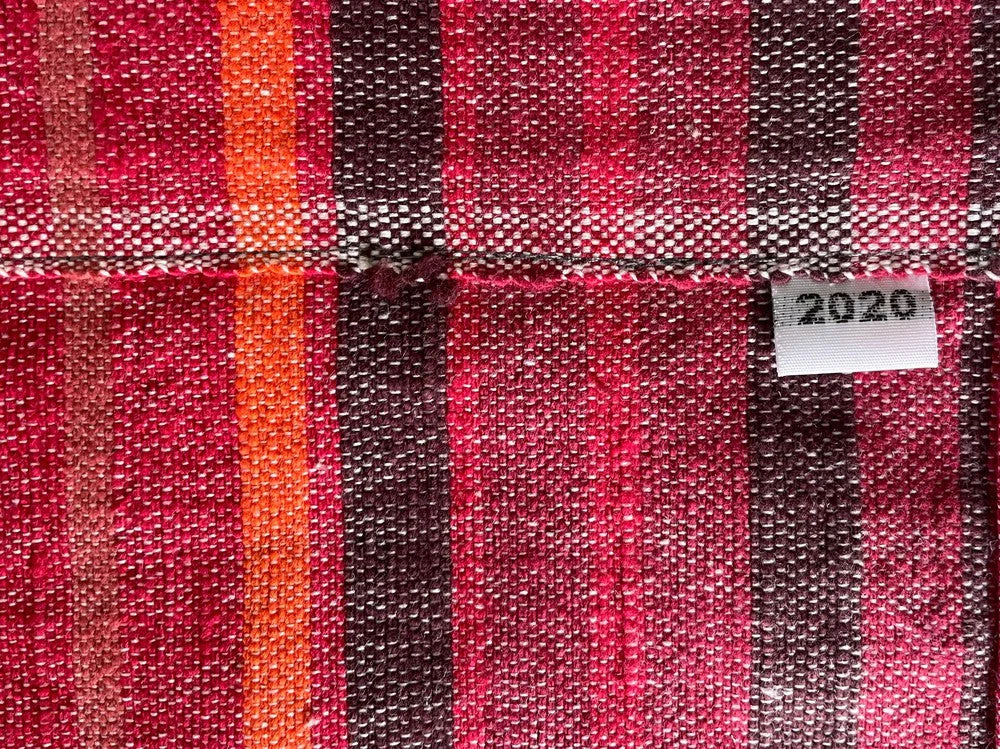
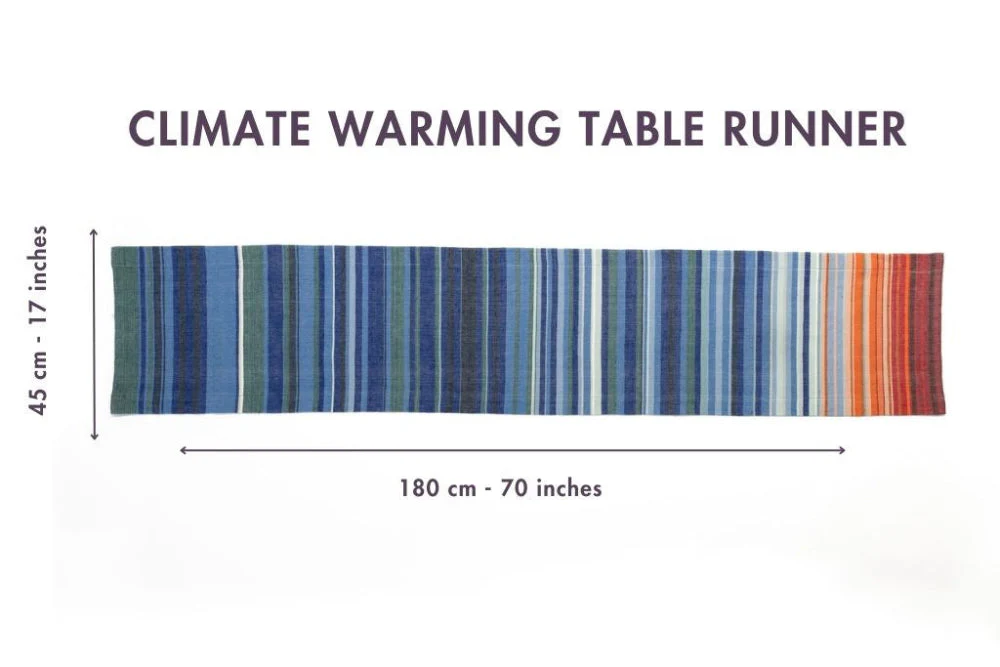
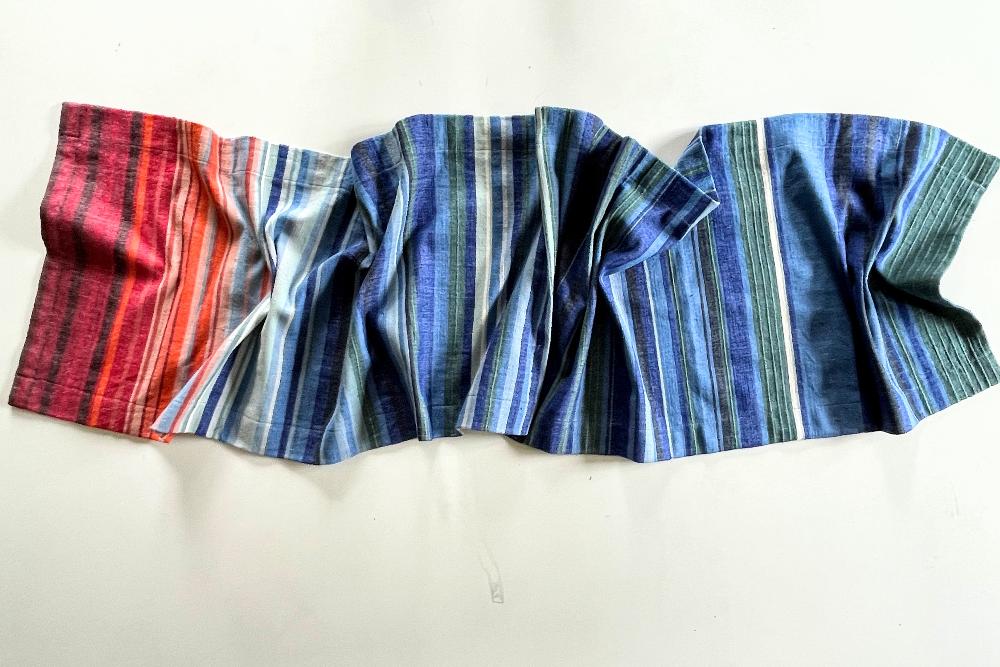
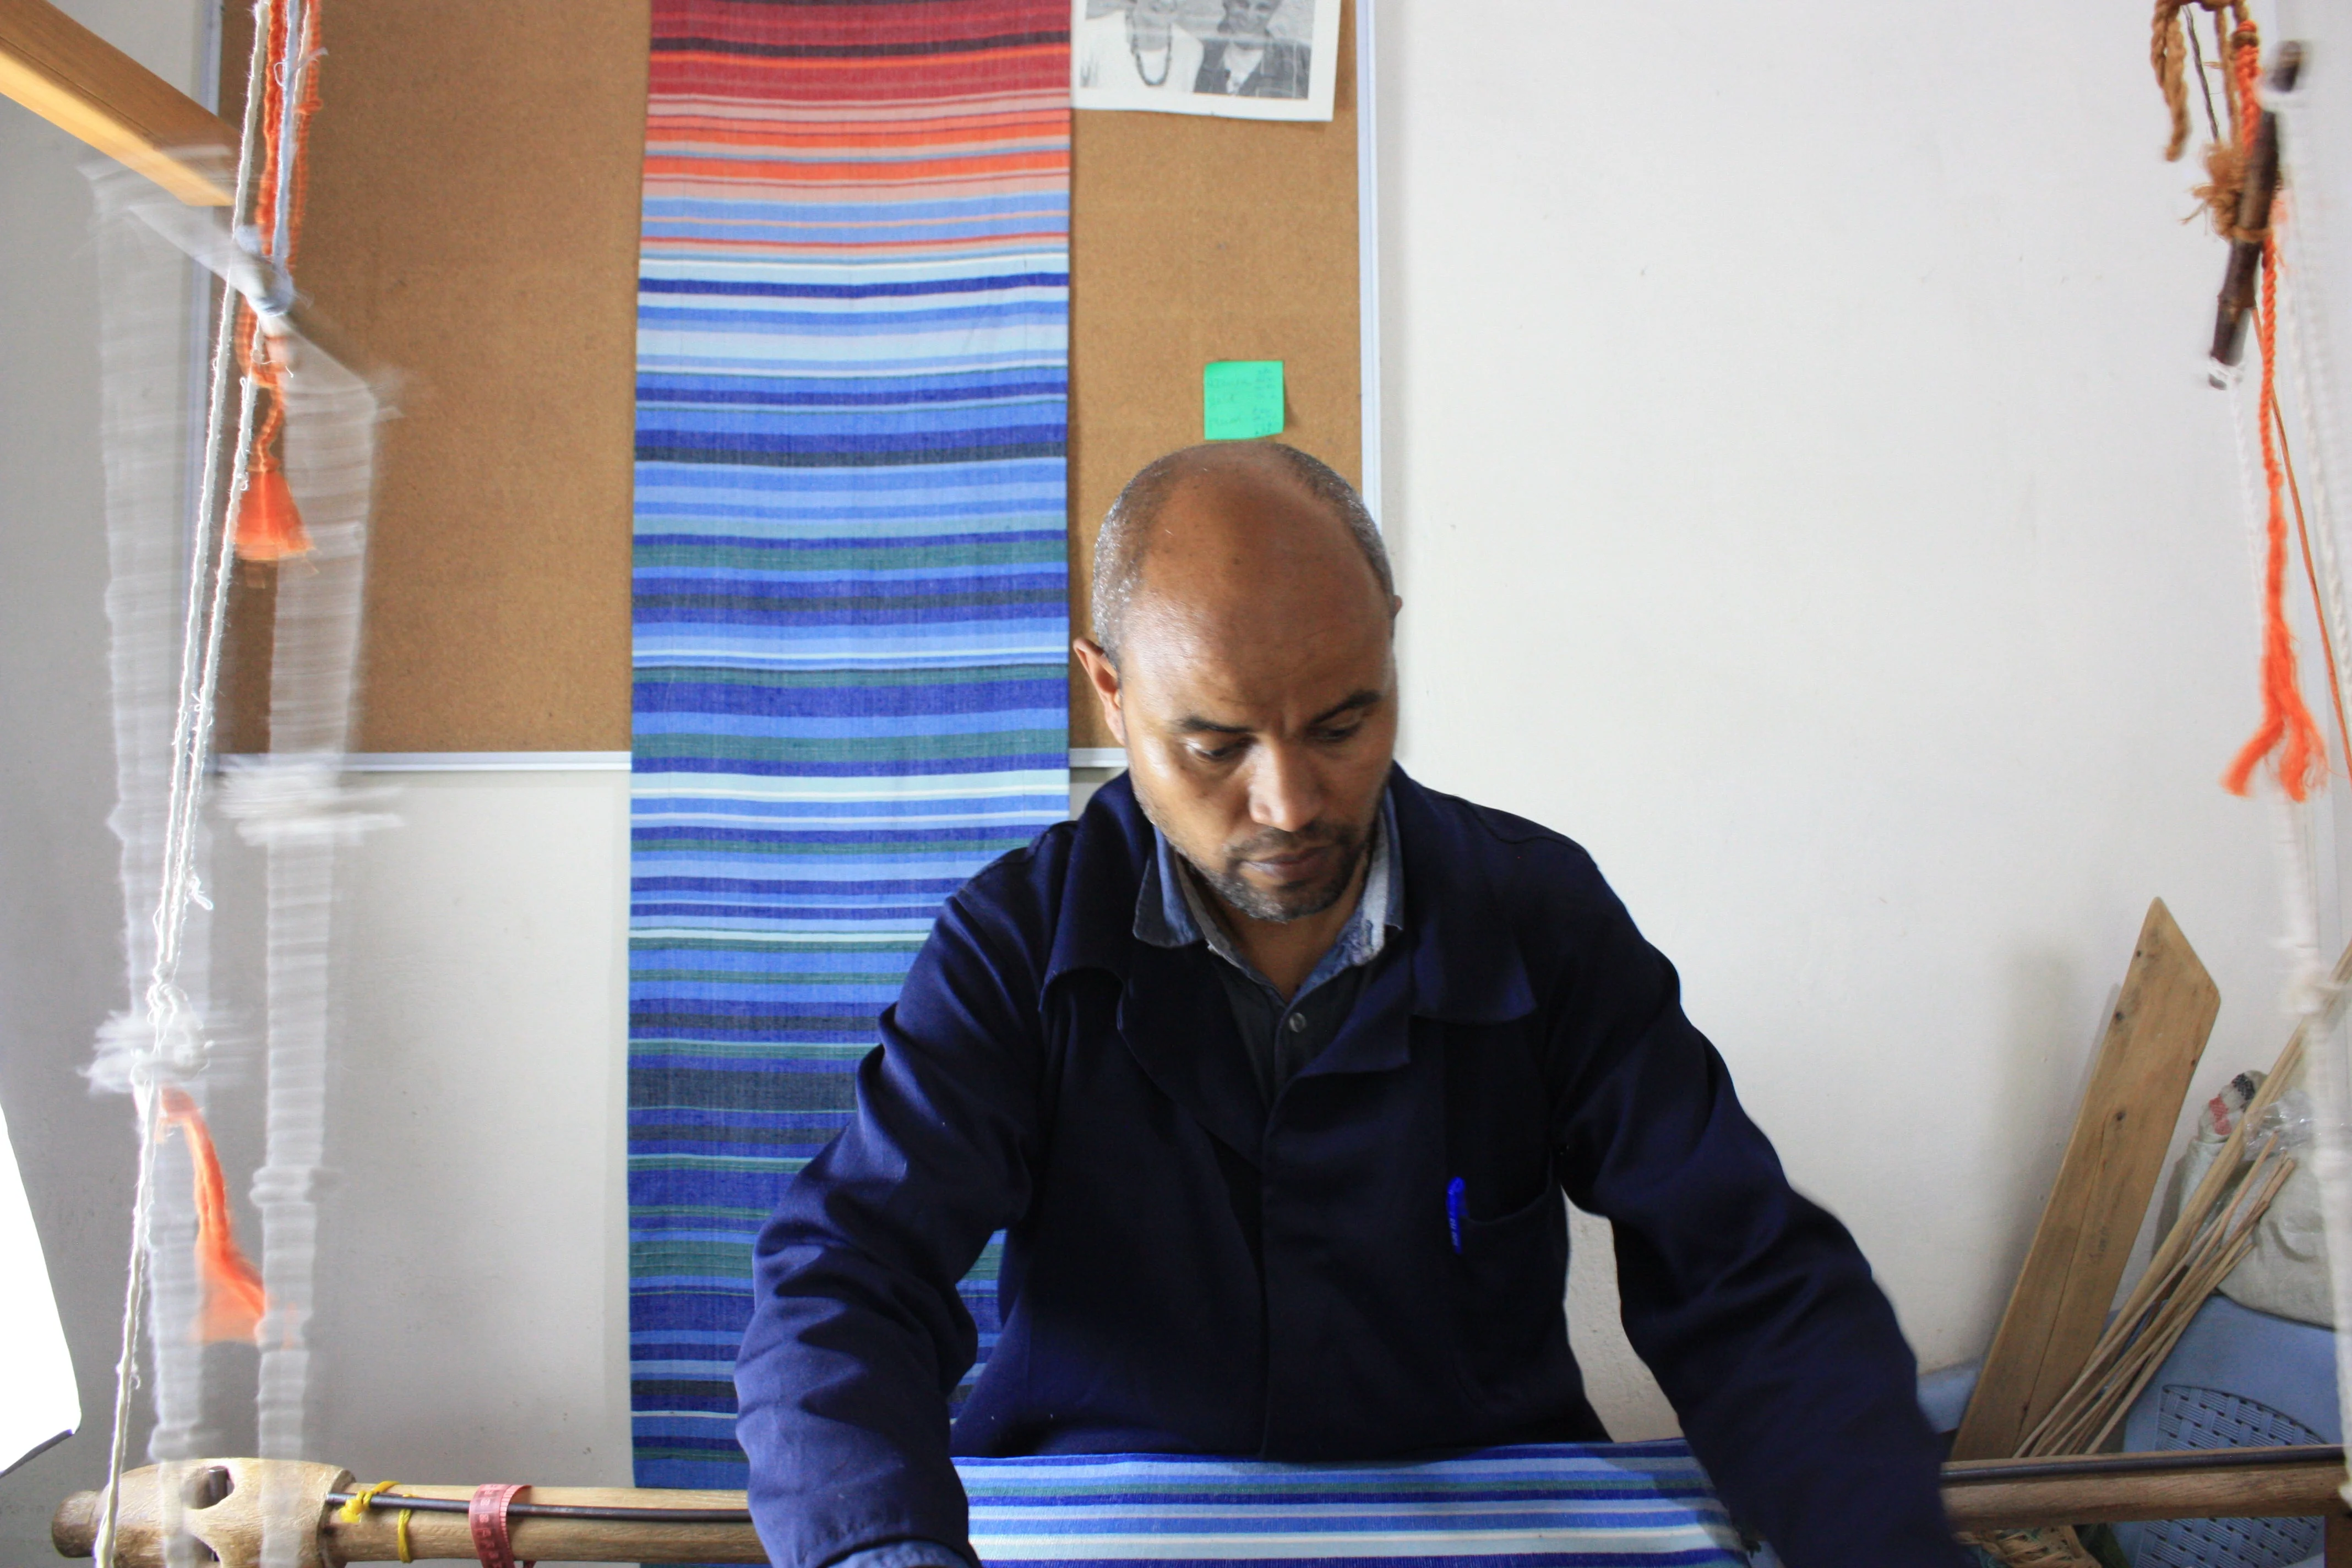
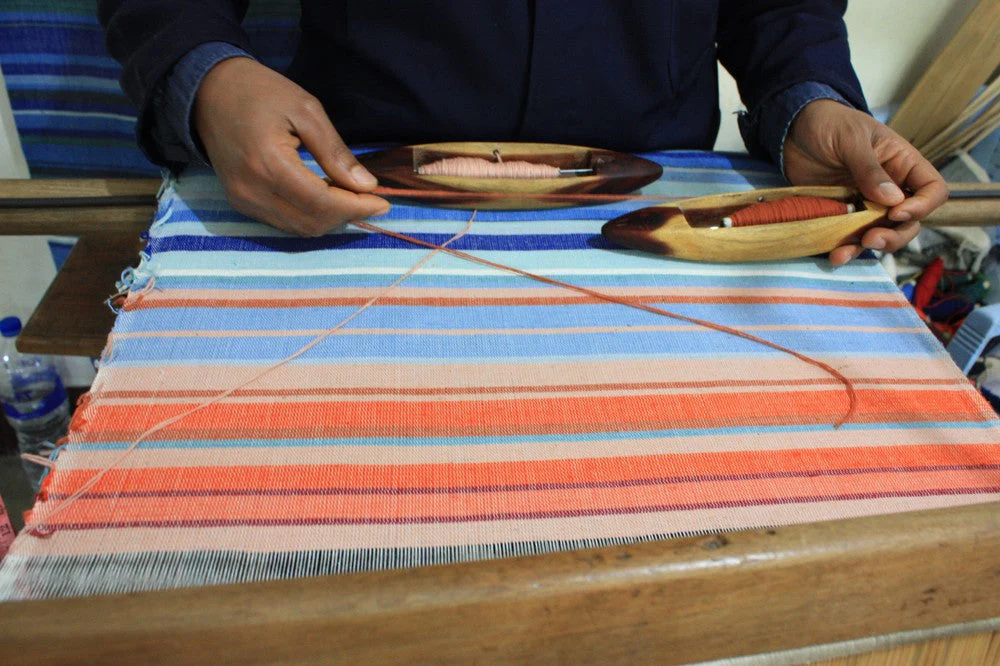
This beautiful, handwoven, Ethiopian cotton table runner is a visual representation of climate change over the past 200 years. The coldest temperatures are shown in blue, while the hottest temperatures are shown in red. They communicate trends of changing temperatures- with the darkest blue and the darkest red representing temperature extremes. We have put tabs showing the dates in history on the back of the runner.
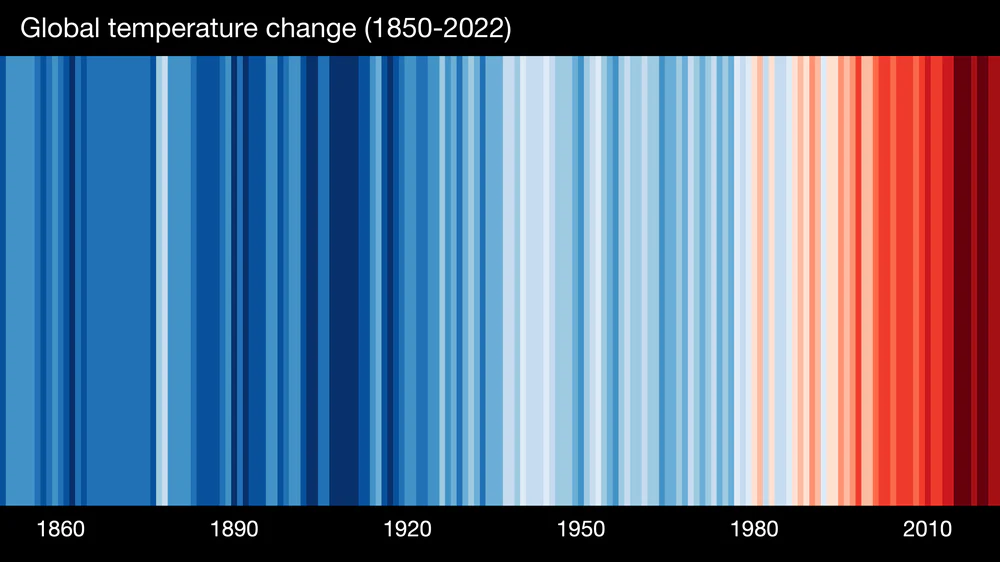
The global climate warming stripes are the creation of two climate scientists from the University of Reading, Ellie Highwood and Edward Hawkins and they represent the average rise in temperature for a single year between 1850 to 2020.
We hope this runner initiates conversations about the rising temperature of our planet.
Original: $93.00
-65%$93.00
$32.55More Images


Climate Warming Ethiopian Handwoven Table Runner
This beautiful, handwoven, Ethiopian cotton table runner is a visual representation of climate change over the past 200 years. The coldest temperatures are shown in blue, while the hottest temperatures are shown in red. They communicate trends of changing temperatures- with the darkest blue and the darkest red representing temperature extremes. We have put tabs showing the dates in history on the back of the runner.
The global climate warming stripes are the creation of two climate scientists from the University of Reading, Ellie Highwood and Edward Hawkins and they represent the average rise in temperature for a single year between 1850 to 2020.
We hope this runner initiates conversations about the rising temperature of our planet.
Product Information
Product Information
Shipping & Returns
Shipping & Returns
Description
This beautiful, handwoven, Ethiopian cotton table runner is a visual representation of climate change over the past 200 years. The coldest temperatures are shown in blue, while the hottest temperatures are shown in red. They communicate trends of changing temperatures- with the darkest blue and the darkest red representing temperature extremes. We have put tabs showing the dates in history on the back of the runner.
The global climate warming stripes are the creation of two climate scientists from the University of Reading, Ellie Highwood and Edward Hawkins and they represent the average rise in temperature for a single year between 1850 to 2020.
We hope this runner initiates conversations about the rising temperature of our planet.